
In my previous article, I tried to cover why metrics are an important part of your security program and some of my beliefs about how metrics should be created and used.
I am often asked about what specific metrics I collect, what metrics are important to my trustees, and how I report on them. I will try to present this information, with the proviso that metrics, like everything else in security, are not one size fits all. You have to make sure that you always take into account your environment and the appetite that your business has for risk.
Let us start with some information you will need to build your metrics. I am a strong believer that metrics should be presented as a normalized number or percentage. For example, saying that we had 37 compromised systems last month can mean two completely different things depending on the total number of systems that make up your environment. A small shop with only 200 machines would have a compromise rate of 18.5%, while a shop with 90,000 systems would come in at 0.04%.
You will need to know:
- Number of systems – Total and # compromised/time period
- Number of network nodes
- Number of employees and, if different, IDs – number of compromised accounts/time period
- Count of systems by OS and versions
As you start building your metrics portfolio, I would highly recommend that you automate the collection process from the beginning. Building the display for this type of metric (number or counting metrics) is straightforward once you have the data. Collecting the data without any automated process will prove to be both onerous and time consuming. While some of these counts may have been static in the old days, with BYOD and IoT, the days of fixed machine counts are long gone.
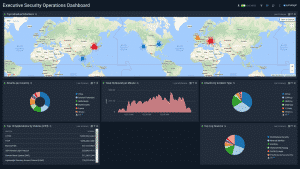
This is a sample of some counting metrics that we collect and display automatically. This is a live dashboard, fed by analyzing netflow data in real time. This is also a sample of what I would classify as “security theater” metrics, meaning that while they are pretty pictures, the value of them is low because we can do little to change these numbers since the computers generating them are not under our control.
We do send emails out to the owners (ISP) of the compromised systems (including logs and brief summary) letting them know that they are hosting hostile compromised systems.
Before the world turned into a global economy, you may have been able to get away with blocking all traffic from a country with which you did not do business. However, the world today makes the Castle and Moat type of security impractical. There may be as much, or even more, “good” traffic from a “bad” country, making blocking all traffic a bad idea.

The world map in our dashboard shows the numbers of IP addresses from the country launching specific attacks against our network. The Attacks by Incident Type shows the kinds of attacks that we are monitoring (we look for over 80 different types of attack behaviors).
The next layer of important metrics to develop are based on your risk management program. IT Risk management is, in simple terms, a process by which a system is analyzed, certified against applicable policies, and then approved. The risk management process is complicated and would require a much larger article to explain.
According to National Information Assurance Training and Education Center, risk assessment in the IT field is:
- A study of the vulnerabilities, threats, likelihood, loss or impact, and theoretical effectiveness of security measures. Managers use the results of a risk assessment to develop security requirements and specifications.
- The process of evaluating threats and vulnerabilities, known and postulated, to determine expected loss and establish the degree of acceptability to system operations.
- An identification of a specific ADP facility’s assets, the threats to these assets, and the ADP facility’s vulnerability to those threats.
- An analysis of system assets and vulnerabilities to establish an expected loss from certain events based on estimated probabilities of the occurrence of those events. The purpose of a risk assessment is to determine if countermeasures are adequate to reduce the probability of loss or the impact of loss to an acceptable level.
- A management tool which provides a systematic approach for determining the relative value and sensitivity of computer installation assets, assessing vulnerabilities, assessing loss expectancy or perceived risk exposure levels, assessing existing protection features and additional protection alternatives or acceptance of risks and documenting management decisions. Decisions for implementing additional protection features are normally based on the existence of a reasonable ratio between cost/benefit of the safeguard and sensitivity/value of the assets to be protected. Risk assessments may vary from an informal review of a small scale microcomputer installation to a more formal and fully documented analysis (i. e., risk analysis) of a large scale computer installation. Risk assessment methodologies may vary from qualitative or quantitative approaches to any combination of these two approaches.
(Source: NIATEC Glossary of terms)
For the purposes of this article, let us assume that you have a risk management process in place and can assign a risk value to the systems that have gone through the assessment. To make this simple, we can use a scale of High, Medium and Low. Our metric would look like a list of systems organized in risk order from High to Low. You may want to build a heat map as I’ve mentioned before. You should include in the presentation the mitigation controls needed to reduce the risk. You should make sure you have calculated the resources needed to implement those controls.
Organizing your metrics this way will give your Board the information they need to either allocate the resources required, or to accept the risks. Make sure that you are prepared to answer any detailed questions they might ask about the risks as well as the process used to determine them.
I am sure that these articles will generate more questions than answers. I view that as a good thing, because metrics can be used to answer those questions. Remember, there is no single answer to all of the questions, but metrics is what you should use to get the answers.